
Understanding Flow Testing
Plumbing and fire protection engineers would ask these questions: "How much water I can draw from a city water supply?" "How much pressure I can get?"
A water distribution system usually consists of pump station(s), water tower(s) or reservoirs(s), and water users, which are interconnected with pipes, valves and other appurtenances.
A water distribution system has its capacity and it is acting interactively at each of its points with pressure and velocity ever changing. When water is drawn from a distribution net, it affects every point throughout the system. It reacts as a system.
When water is drawn at one point, water may come from every direction from where the pressure is higher than the drawing point. At the same time, water pressure at other points lowered and flow in the piping changed.
Modern computerized methods can simulate a network and analyze the flow and pressure in the whole system (or net or network). However, these sophisticated methods also have their limitations. It is because the system never can be 100% simulated. You have to make assumptions, such as the materials, sizes, fittings and conditions of piping, etc. Furthermost, you may also have to consider the pump curves, water level change in water towers or reservoirs, valve characteristics (open fullness, check valve types, etc.), even water hammers, and so on. A lot more can be listed.
Also, when you need only to know the drawing capacity of the water supply for only an small area, or even a building, it seems neither necessary, nor possible to analyze the system serving the whole city or cities.
Here it is! A flow test can meet your need in many times.
Before we introduce the flow test procedure and analysis, let us review some hydraulics. When water flowing in full in a pipe, it counts the resistance of the pipe wall. The smoother the wall is, the less the resistance will be. The velocity close to pipe wall is slower than that close to the center line, resulting power loss from the friction between water and pipe walls. When velocity reaches a certain limit, it may flows in different directions instead of flowing forward, resulting whirling and mixing. The friction between molecules of water causes another kind of power loss.
There are two kind of flows depending on velocity, pipe diameter, viscosity of water and mass density of water. One is laminar flow and the other is turbulent flow. There is only shear stress in laminar flow and the power loss is much less than in the turbulent flow. Unfortunately, in most of plumbing and fire protection engineering cases, the flow is in turbulent state. The indicator for distinguishing laminar and turbulent flow is Reynolds Number(Re), which can be expressed as:
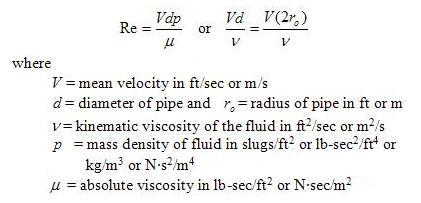
If Re is less than 2100, the flow is in laminar state. If Re is larger than 4100, the flow is in turbulent state. If Re is from 2100 to 4100, it is in transition state.[1]
For V = 4 ft/sec, d = 0.3333 ft (i.e. 4 inch) and ν = 1.217 ft2/sec, Re = 108460, which is much larger than 4100 and thus we know it is in turbulent state.
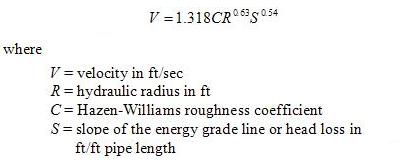
It is well recognized that Hazen-Williams formula is one of the most practical empirical formulas for resolving the water flow problems in pipes flowing in full:
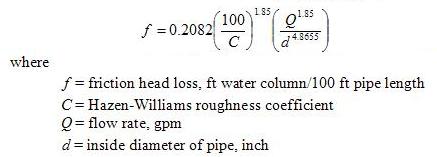
The above formula can be converted into the following format:
For an existing water distribution system, we do not know what the actual C is. We usually do not know the actual pipe diameter because the pipe may become bigger from corrosion or smaller owing to growth of iron bacteria or slime. Field survey and analysis reveal that an existing cast iron pipe supposedly with C = 140 indicated an actual C = 90 or less. Moreover, piping may be clogged somewhat in some places, or valves are not fully open. These factors all make a calculation with much uncertain.
When we design a new system, it makes us no choice but calculate with best assumptions. However, for an existing system, when the only thing we want to know is how much water we can get at how much pressure, we can leave everything else alone for the water company.
Now that we only care about the flow and pressure, things become much simpler. For a given system, everything is constant except flow and pressure. Therefore, Hazen-Williams formula can be expressed in the following format:
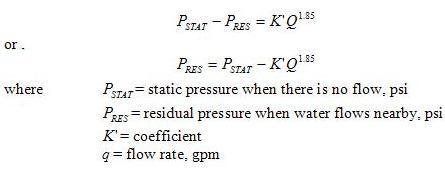
The above formula can be rewritten as:
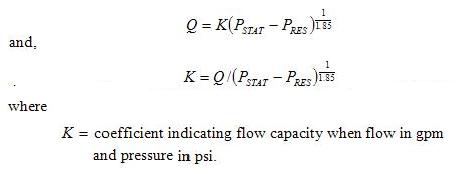
As soon as K value has been established, the available pressure, PAV at a given flow, QREQ , can be calculated:

Hydraulic calculation of a plumbing or fire protection system will result a required pressure, PREQ. The difference between PREQ and PAV indicates if the existing water supply system has adequate capacity or needs to have a boost pump.
For a given system under testing, K is constant. The larger the K value, the bigger the flow capacity of the system. Theoretically, one set of flow test data can determine K value. In practice, it is recommended to run flow test twice or more in order to ensure the accuracy. Also, the difference between the static and residual pressure should not be less 20 psi for the same purpose. Since the condition of a water system is ever changing, and thus the capacity of it, the design of a project can only be based on the recent flow test data, usually within one year, depending on the requirement of local code.
Plumbing and/or fire protection codes require that the pressure in the distribution system never be below 20 psi to avoid contamination from outside of piping.
For SI system, if pressure is in kPa and flow in L/s, the K-factor denotes as KL/s-kPa will be 45 times less than K as calculated in the above mentioned formula, i.e.
The K-factor conversion of the sprinkler head is a little different because the flow is proportional to pressure to the second power, i.e. P2 instead of 1.85 in Hazen-Williams formula. Refer to K-Factor Conversion for more information.
How to conduct a flow test [2]
- Select a hydrant to record pressures (called the residual hydrant)
- Remove one of the 2-1/2-inch caps and replace it with a 2-1/2-inch cap with 1/4-inch threaded connection for a pressure gauge. Provide a test cock on the connection for blowing off air.
- Open the hydrant and record the pressure. This pressure is known as the static pressure.
- Select hydrant(s) for flow measurements.
- Operate hydrant(s) and measure velocity pressure through flowing outlets by use of Pitot tube and gauge. It is best to pitot the flow from a playpipe connected to a hoseline from the hydrant, rather than the flow discharging directly from the hydrant.
- With water flowing, record the pressure at residual hydrant. This is known as the residual pressure.
- Calculate the flow of water from each open orifice from charts or the formula:
In US Customary System:
Q - flow in gpm
C - the coefficient of discharge of the orifice, C = 0.70, 0.80, or 0.90 depending on the outlet configuration. Refer to NFPA 291 for detail.
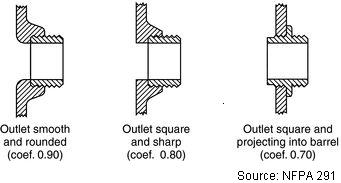
d - the diameter of the outlet in inches
P - the pressure recorded on the pitot gauge in psi
In SI System:
Q - flow in L/h
C - same as above
d - the diameter of the outlet in mm
P - the pressure recorded on the pitot gauge in kPa
References:
1. Eric Bakeman, Jarlath McEntee, Stirling Machine Analysis,
2. Maintenance of fire protection systems, by United States. Dept. of the Army, United States. Navy Dept, United States. Dept. of the Air Force